Percentiles Chart Item
Percentiles charts shows the point at which a certain percentage of observed values occur. For example, the 95th percentile is the value which is greater than 95% of the observed values. If you have an 95th average response time at 10sec, it means that 95% of average response time are below this value.

Several metrics are available, please report to the Hit Metrics Availability table.
Edit a Metric
To customize a specific metric, please refer to the documentation page about the legend and metrics.
Export as PNG
To export the chart as a PNG image, please refer to the documentation page about exporting tables.
Insertion panel
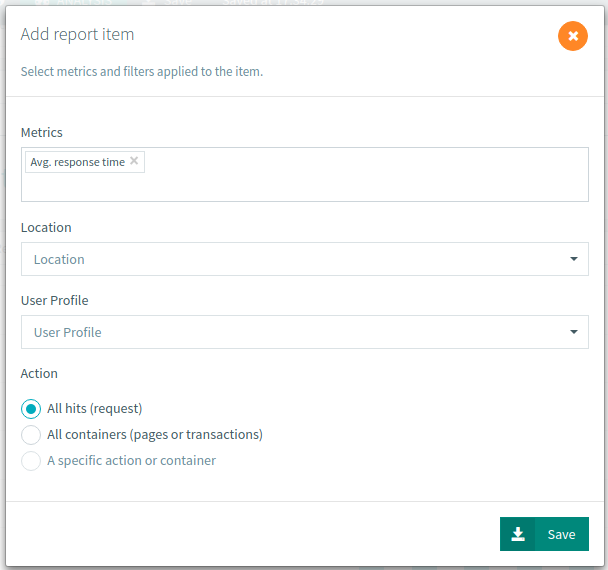
When inserting a new Percentiles Chart in your report, an insertion panel is displayed to help you quickly select metrics and apply filters to the whole chart:

The following filters are applied to every column of the table:
- Location: Select the region to get statistics from this region only,
- User profile: Select a specific user profile,
- Type/Action: Show either global Container or Hit (Request) results or the results for a specific action or container.
Click on the Save button to apply the modifications or on the Close button ![]() to keep the original report item (it is still inserted but your modifications are not applied).
to keep the original report item (it is still inserted but your modifications are not applied).